Pandas Tips And Tricks For Finance
What is about?
Here I’m tracking of the collection of useful functions for the analysis of time series with Pandas.
Correlation
- Taken from
Python for Finance, 2nd Edition
Python for Finance, 2nd Edition
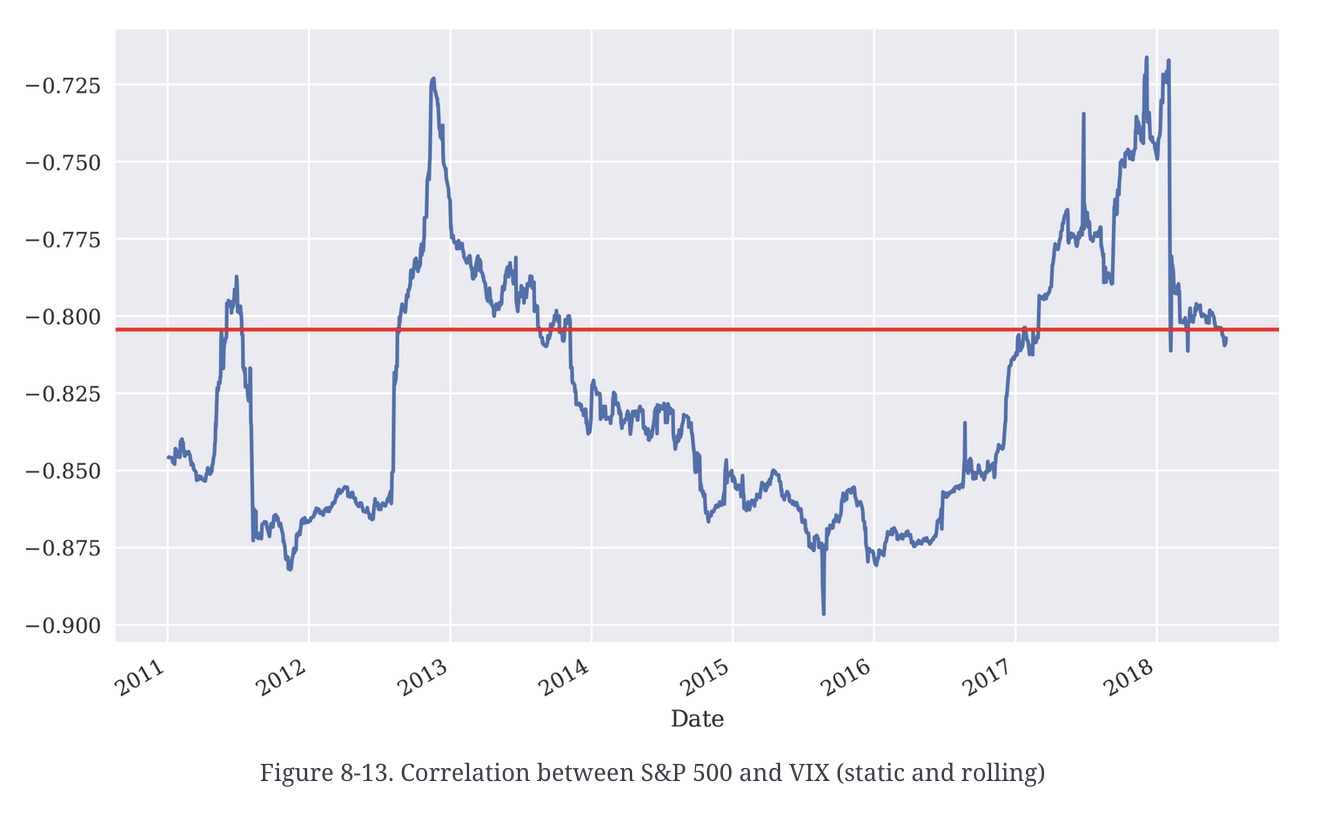
rets.corr()
Out[56]:           .SPX      .VIX
         .SPX  1.000000 -0.804382
         .VIX -0.804382  1.000000


In [57]: ax = rets['.SPX'].rolling(window=252).corr(
                           rets['.VIX']).plot(figsize=(10, 6))
         ax.axhline(rets.corr().iloc[0, 1], c='r');